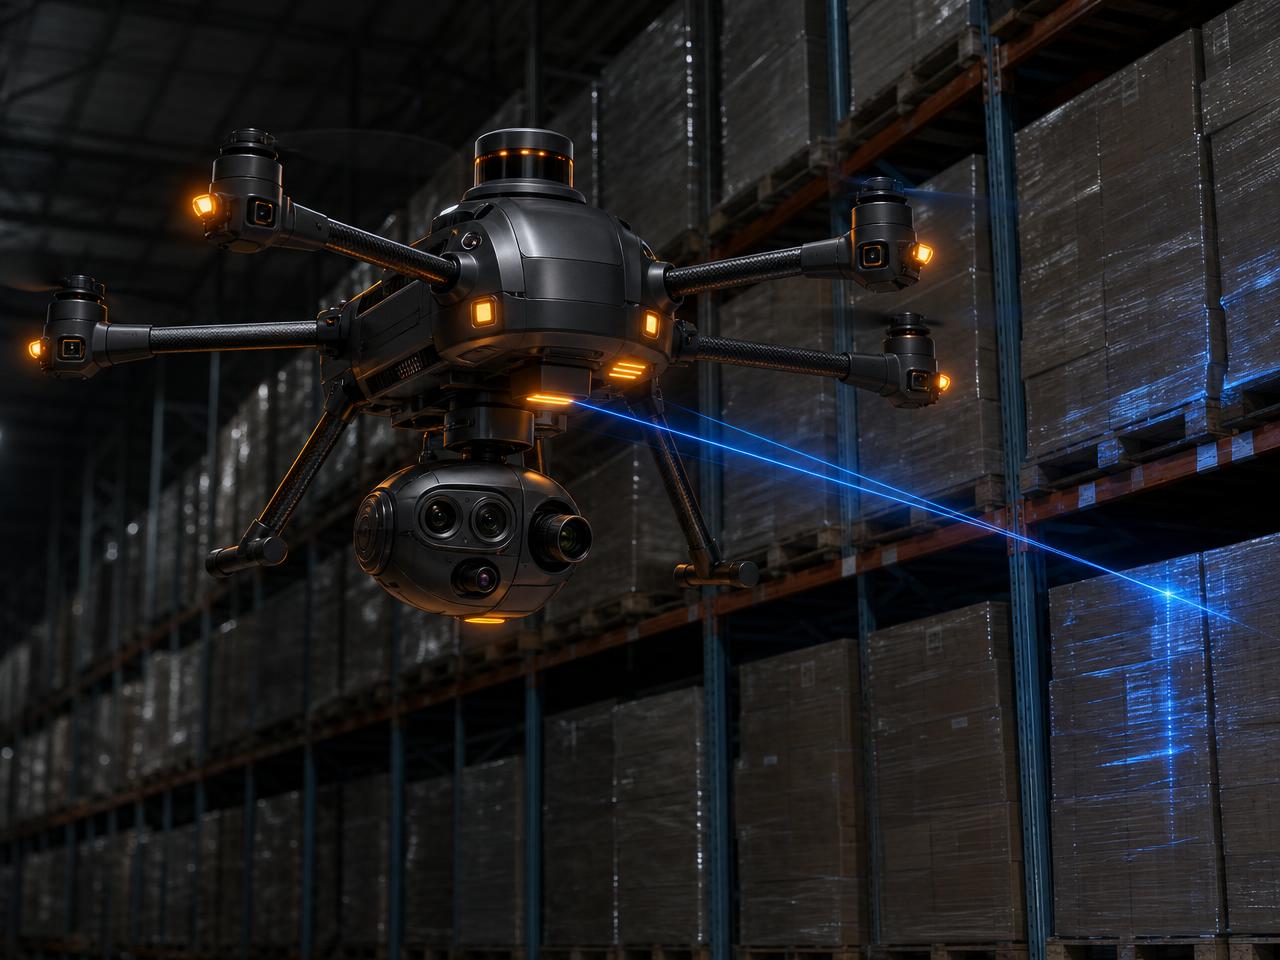
Type 06 · Warehouse merchandise counting
Every pallet counted before the doors open
The drone flies the aisles and the laydown yard on a fixed path, counts every pallet, bundle, keg and case in blue laser, reads the tags, and hands management a variance report against the stock list — no ladders, no order pickers, no shutting the building down for a physical count.
The sweep
Eight checks per aisle, per bay
Pallet & case count
Every pallet position counted, layers and cases per stack read from the scan
Bundle & length count
Rebar bundles, lumber packs, pipe and conduit counted by piece and by length
Label & tag read
Barcode, QR and heat-number tags read from the air and matched to the stock list
Bin-location match
Material found where the system says it is — or flagged as misplaced
Empty & partial slots
Open rack positions and broken pallets logged so buying is based on real stock
Damage & condition
Torn bags, wet stacks, rusted bundles and crushed cases photographed with the count
Aging & turns
How long each lot has sat since it landed, flagged before shelf life runs out
Variance vs system
Counted quantity against the stock list, with a plus/minus per SKU
Racking · pallet count
Counted layer by layer, all the way to the top beam
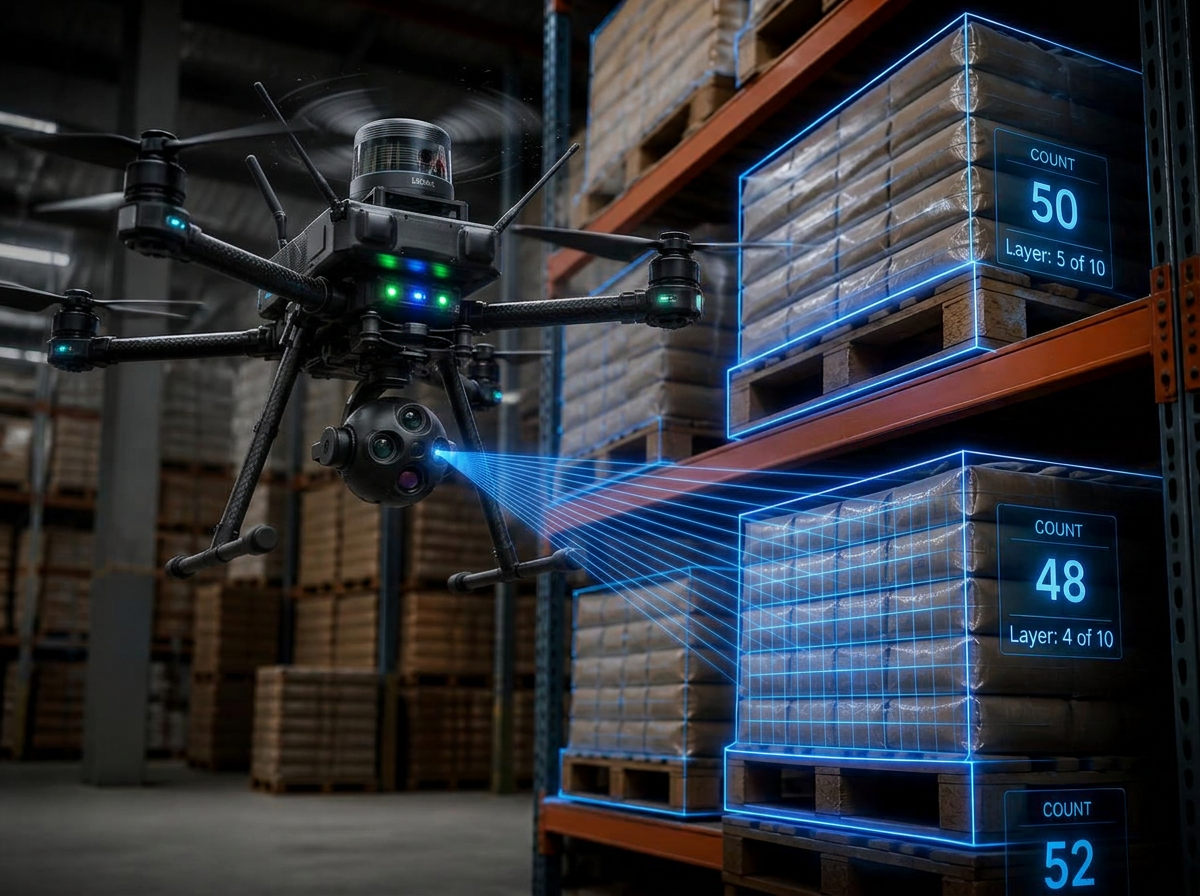
Top-beam stock is the stock nobody counts, because counting it means a lift truck and a two-hour window. The drone flies the rack face at every level, resolves the stack geometry and returns a count per pallet position — including partials and the empty slots hiding behind a full front row.
- Count unitPallet position, layer, case and piece
- Rack levelsGround through top beam, no lift required
- Partial palletsCounted as a fraction, not rounded to a full unit
- Empty slotsLogged by bin location for put-away planning
- Cycle timeA full aisle flown while the building is empty
Identity · label & tag
A count is worthless if the SKU is wrong
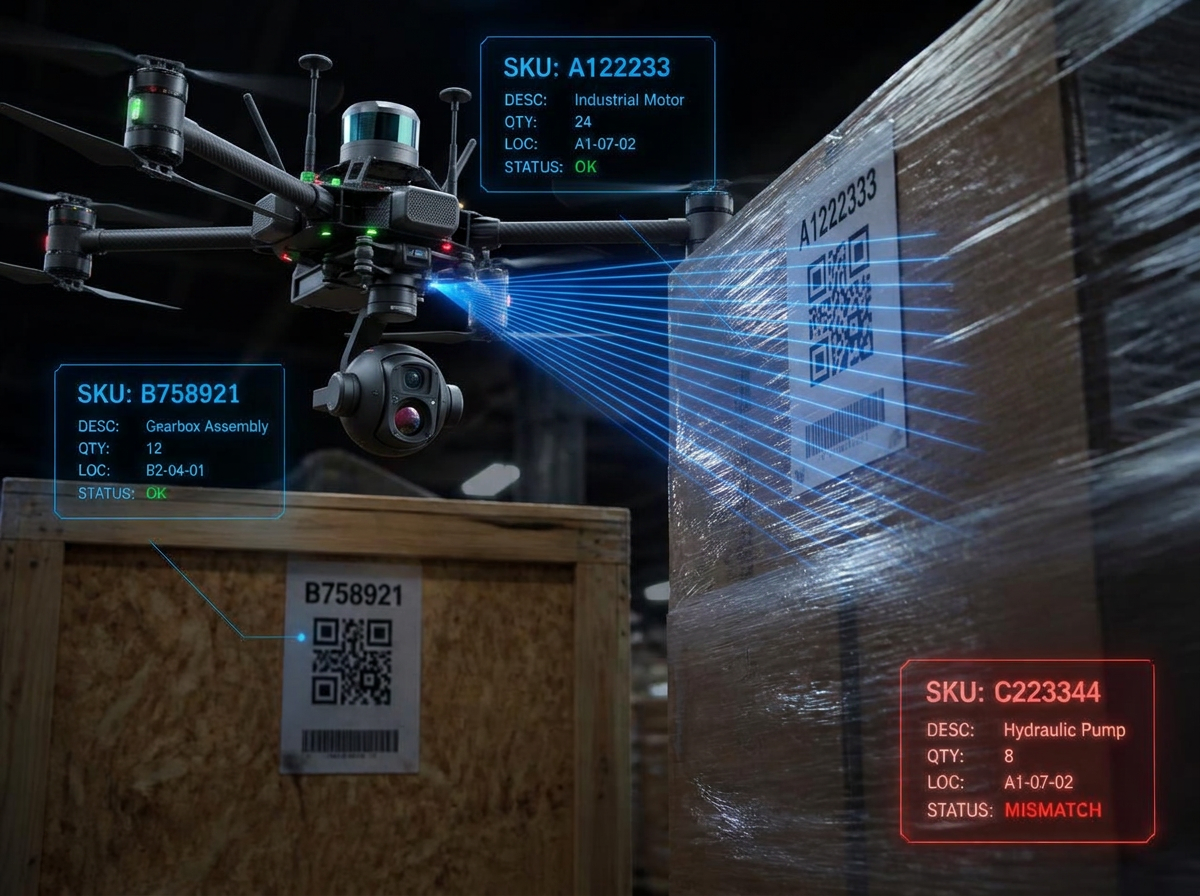
The sensor ball reads barcodes, QR labels, bundle tags and heat numbers from the air and ties each read to a bin location. Material sitting in the wrong slot, mixed lots on one pallet, and labels that no longer match what is on the pallet all surface as exceptions rather than as a surprise at the point of issue.
- Reads1D barcode, QR, bundle tag, heat number
- Bin matchRead location compared to the system location
- Mixed lotsTwo SKUs on one position flagged separately
- UnreadableTorn or turned labels listed for manual re-tag
- Photo evidenceEach read carries the frame it was taken from
Outdoor · laydown yard
The yard counted the same way as the racks

Bundles of #5, lumber packs, pipe coils and scaffold frames get dropped where the truck could reach, not where the system says. One overflight builds a map of the yard with a count and a position for every stack, so the crew is sent to material that is actually there.
- Bundle countPieces per bundle and bundles per stack
- Bar size sort#4 vs #5 vs #6 separated by rib pattern and diameter
- Stack positionGrid coordinate for each stack in the yard
- WeatheringStanding water, rusted bundles and torn wrap flagged
- Delivery reconcileCounted against the packing list on the same morning
Variance report
One line per SKU, located by bin
| Location | Item | Counted | On the system | Status |
|---|---|---|---|---|
| A1-07-02 | Cement, 94 lb bags | 48 pallets | 52 pallets | Short — reorder |
| YARD · R3 | #5 rebar bundles, 20 ft | 42 bundles | 42 bundles | Reconciled |
| B2-04-01 | 3" PVC DWV fittings | 12 cases | 18 cases | Short — reorder |
| C4-01-03 | Anchor bolts 3/4 x 12 | 9 kegs | 10 kegs | Recount today |
| YARD · L1 | 2x4 SPF lumber packs | 28 stacks | 26 stacks | Recount today |
| D1-02-04 | Scaffold frames 5 ft | 36 frames | 36 frames | Reconciled |
Counts are what the drone saw on the sweep. Your stock system, purchase orders and the warehouse manager's judgement override every figure here.
Deliverable
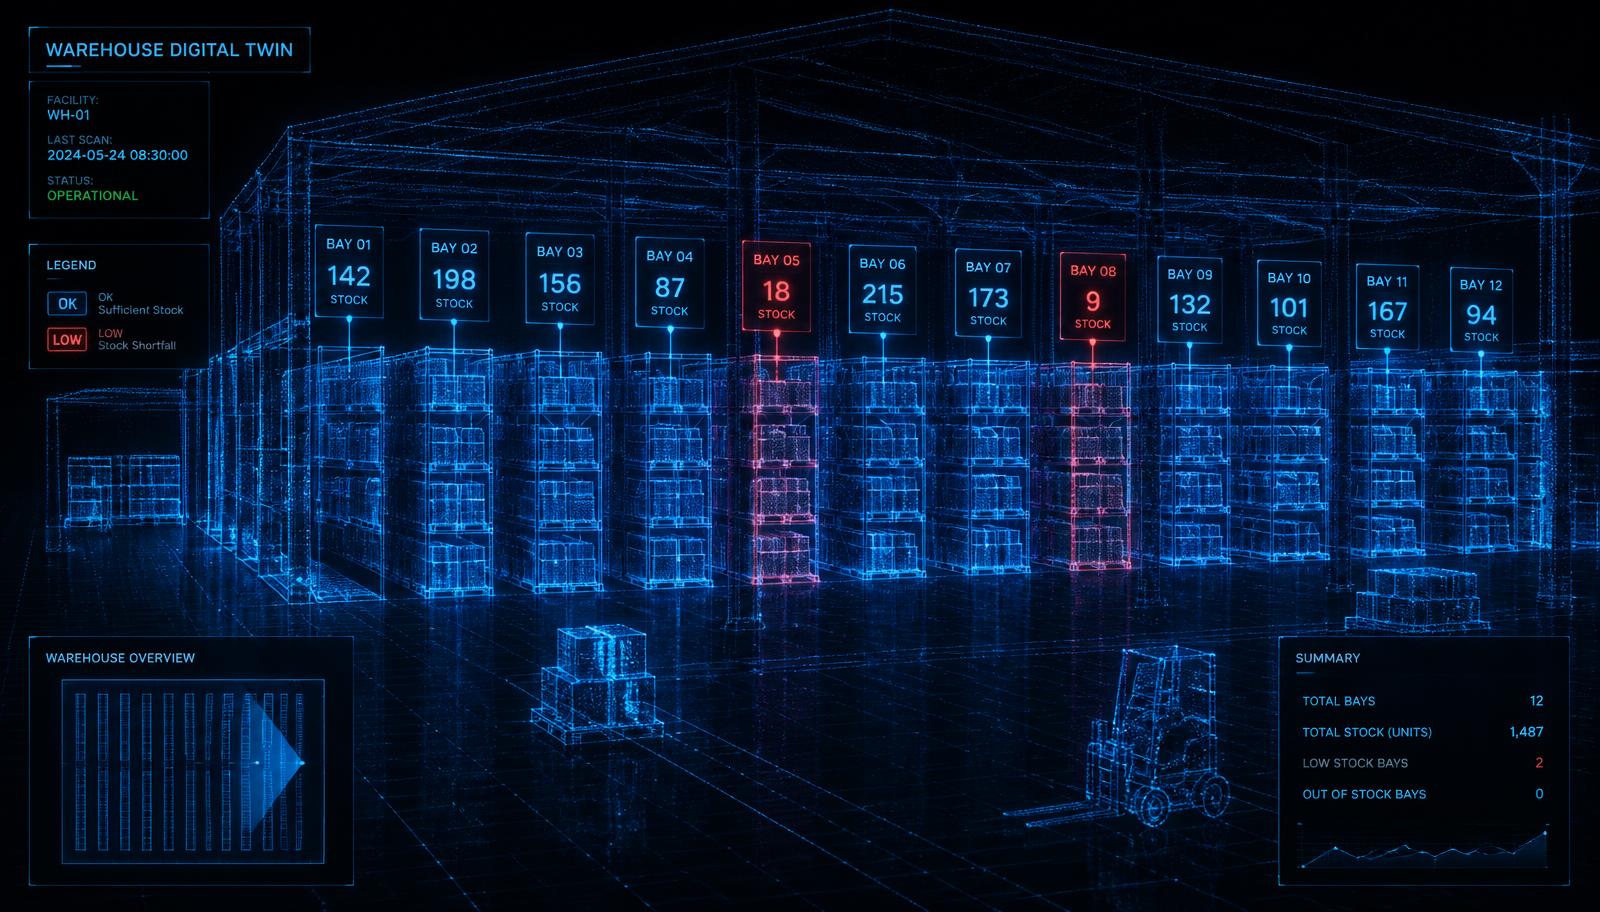
A dated picture of what the warehouse actually holds
06:00 count
The sweep runs on an empty floor before the first shift, so nothing has to stop and no one counts from a lift.
Variance report
Counted vs system per SKU and per bin, with the frame the count came from, in management's hands by start of shift.
Shortfall alert
Anything below the reorder point on a critical item goes out as an alert to purchasing the same morning, not at month end.
Sonar · ultrasonic ranging
Laser and LiDAR are the primary measurement layer, but they lose confidence on dark, wet, dusty or mirror-like surfaces and at very short standoff. Sonar fills that gap: ultrasonic pulses resolve the small stuff — millimetre-scale gaps, offsets, thin clearances and shallow voids — in low light, through airborne dust and against surfaces a laser skips off. On this page it is what confirms pallet-to-rack clearance, stack height and aisle width in low light where racking is dark and non-reflective.
What you’ll receive
Asset, inventory & laydown verification — CSV/spreadsheet reconciliation against the asset register + photo log + PDF variance report.
Open formats only: GeoTIFF · LAS/LAZ · E57 · OBJ/FBX · DWG/DXF · LandXML · PDF · CSV. No proprietary viewer required.
What it costs when nobody's watching
“Missing since when?” is the most expensive question in the yard.
est. $300M–$1B / yr
U.S. construction equipment theft, with under 25% of stolen equipment ever recovered.
Source: DOE data via 2025–2026 industry security roundups
~$30,000
average loss per incident, across more than 11,000 reported incidents a year.
Source: National Equipment Register / NICB — 2014 baseline, still the most-cited figure; treat as estimated
+~$1B / yr
copper wiring theft on top of equipment losses.
Source: U.S. Department of Energy data, cited across 2025–2026 security roundups
~$31B / yr
rework tied to bad, missing or wrong project data — including material counts nobody reconciled.
Source: PlanGrid / FMI, Construction Disconnected (2018)
$60.1M · 12.5 months
average construction dispute value and duration; a dated count is a dated record of what was on site.
Source: Arcadis, 2025 Global Construction Disputes Report
$15.8B / yr
industry cost of poor data and interoperability between systems and the field.
Source: NIST GCR 04-867 / NIBS (2004) — historical baseline
Government-grade sources (BLS, OSHA, NIST/NIBS) are cited as published. Industry research (Arcadis, FMI/Autodesk, CII, NSC) is survey- and estimate-based. Vendor case studies and vendor pricing pages are labeled where used and should be read as documented examples, not industry averages.