
Type 03 · Concrete management
Every mixer truck on a clock the drone keeps
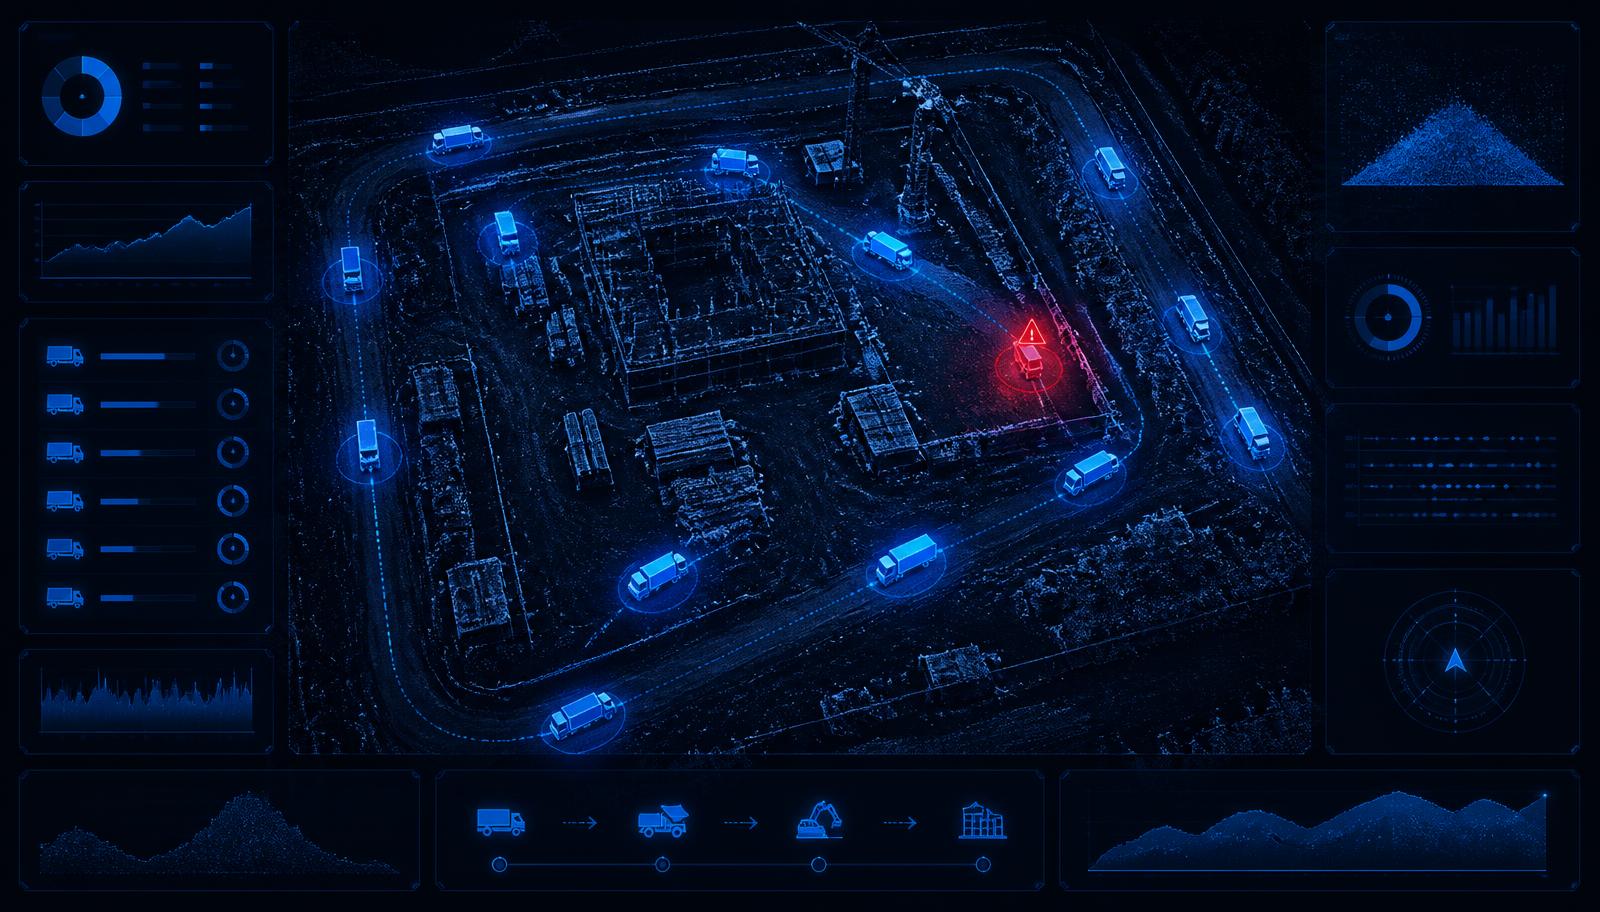
Concrete has a shelf life, and the city puts a limit on how long a loaded truck may sit on site. The drone stamps every arrival, times every load, and when a truck passes the window it sends the alert: this one goes back, it does not go in the structure.
The watch list
Eight things tracked per load
Gate arrival stamp
Plate and drum read at the gate, arrival time written the moment the truck crosses the line
Dwell time on site
A live clock per truck from arrival to departure, against the city's allowed limit
Batch-to-discharge
Time since batching at the plant, the clock the concrete actually cares about
Drum revolutions
Rotation count tallied from the air and checked against the mix limit
Queue depth
How many trucks are waiting and how long the line has been growing
Idle vs discharging
Whether a truck is actually pouring or just holding a load in the sun
Departure stamp
Exit time recorded so every load has a closed, auditable window
Reject alert
Automatic notice to management naming the truck that has to be turned back
Gate · arrival
The clock starts where the truck crosses the line

The drone reads the plate and the drum number at the gate and writes an arrival stamp that nobody has to remember to record. From that second the load has two running clocks: time on site, and time since it was batched at the plant.
- IdentificationPlate, drum number and haulier livery
- Arrival accuracy± 2 seconds on the gate crossing
- Ticket matchLoad linked to its delivery ticket and mix design
- Clocks startedOn-site dwell · batch-to-discharge
- CoverageContinuous during the pour window, no manual gate log
Live board
One line per truck, one limit per column
| Truck | Since batching | On site | Drum revs | Status |
|---|---|---|---|---|
| MX-114 | 0:38 | 0:12 | 148 | Within limit |
| MX-121 | 1:04 | 0:29 | 212 | Within limit |
| MX-107 | 1:22 | 0:44 | 254 | Approaching limit |
| MX-098 | 1:41 | 1:06 | 288 | Send back |
| MX-133 | 0:19 | 0:04 | 96 | Within limit |
Limits shown are the common defaults: 90 minutes batch-to-discharge, 300 drum revolutions, and the site's permitted dwell window. The project specification and the city's permit conditions override every figure here.
Alert
Past the window, the load is a liability

Concrete that sits too long stiffens, loses slump and gets watered on site to make it pumpable — which is exactly how a specified 4000 psi mix ends up as something weaker and permanently inside the structure. When a truck crosses its limit the drone raises the alert by name, so management turns it around instead of arguing about it after the cylinders break low.
- Batch-to-discharge limit90 minutes, or 60 in hot weather
- Drum revolution limit300 total revolutions
- Site dwell limitPer the city permit condition for the pour
- RetemperingAdding water on site is a flagged event, not a fix
- Alert routingSuperintendent, project manager and concrete foreman only
- EscalationInternal daily roll-up to management, per haulier
Discharge
Idling and pouring are not the same minute
The drone separates a truck that is discharging from one that is simply holding a load, so waiting time is attributed honestly. That distinction is what turns the record into a demurrage conversation with facts, and what tells the plant to slow the next dispatch before the queue builds again.
- Discharge detectedChute down, drum reversed, material flowing
- Typical discharge8–12 minutes per truck
- Waiting time attributedSite queue vs plant over-dispatch
- Pour rateCubic yards per hour, live against the plan
- Cold joint riskFlagged when the gap between loads runs long

Deliverable
A closed record for every cubic yard that entered the building
Live alerts
A named push to management the moment a load passes its limit, with the truck, the elapsed time and the recommendation to reject.
Pour log
Arrival, discharge and departure stamps per truck, with dwell time, revolutions and queue depth across the whole pour.
Haulier scorecard
Late loads, over-limit loads and waiting time by supplier and by day — the evidence behind the next dispatch conversation.
What you’ll receive
Concrete truck dwell tracking — PDF dwell exception report + CSV log of every arrival, departure and time-on-site, with the timestamped photo record.
Open formats only: GeoTIFF · LAS/LAZ · E57 · OBJ/FBX · DWG/DXF · LandXML · PDF · CSV. No proprietary viewer required.
What it costs when nobody's watching
A dwell argument without timestamps becomes a dispute with lawyers.
$60.1M · 12.5 months
average U.S. construction dispute value and time to resolve.
Source: Arcadis, 2025 Global Construction Disputes Report
#1 root cause
failure to properly understand or comply with contract obligations — the most common dispute cause Arcadis records, year after year.
Source: Arcadis, 2025 Global Construction Disputes Report
52%
of total project cost overrun traces back to rework — including rejected and ruined pours.
Source: CII, analysis of 150+ industrial construction projects
~$65B / yr
U.S. construction rework cost, roughly 5% of total construction spend.
Source: Autodesk / FMI, Harnessing the Data Advantage in Construction (2020/2022)
~$31B / yr
rework tied to bad, missing or wrong data — including undocumented batch and arrival times.
Source: PlanGrid / FMI, Construction Disconnected (2018)
$15.8B / yr
industry cost of poor data handoff between systems, suppliers and the field.
Source: NIST GCR 04-867 / NIBS (2004) — historical baseline
Government-grade sources (BLS, OSHA, NIST/NIBS) are cited as published. Industry research (Arcadis, FMI/Autodesk, CII, NSC) is survey- and estimate-based. Vendor case studies and vendor pricing pages are labeled where used and should be read as documented examples, not industry averages.