
Type 01 · Cast-in-place structure
Concrete & rebar verification before the pour
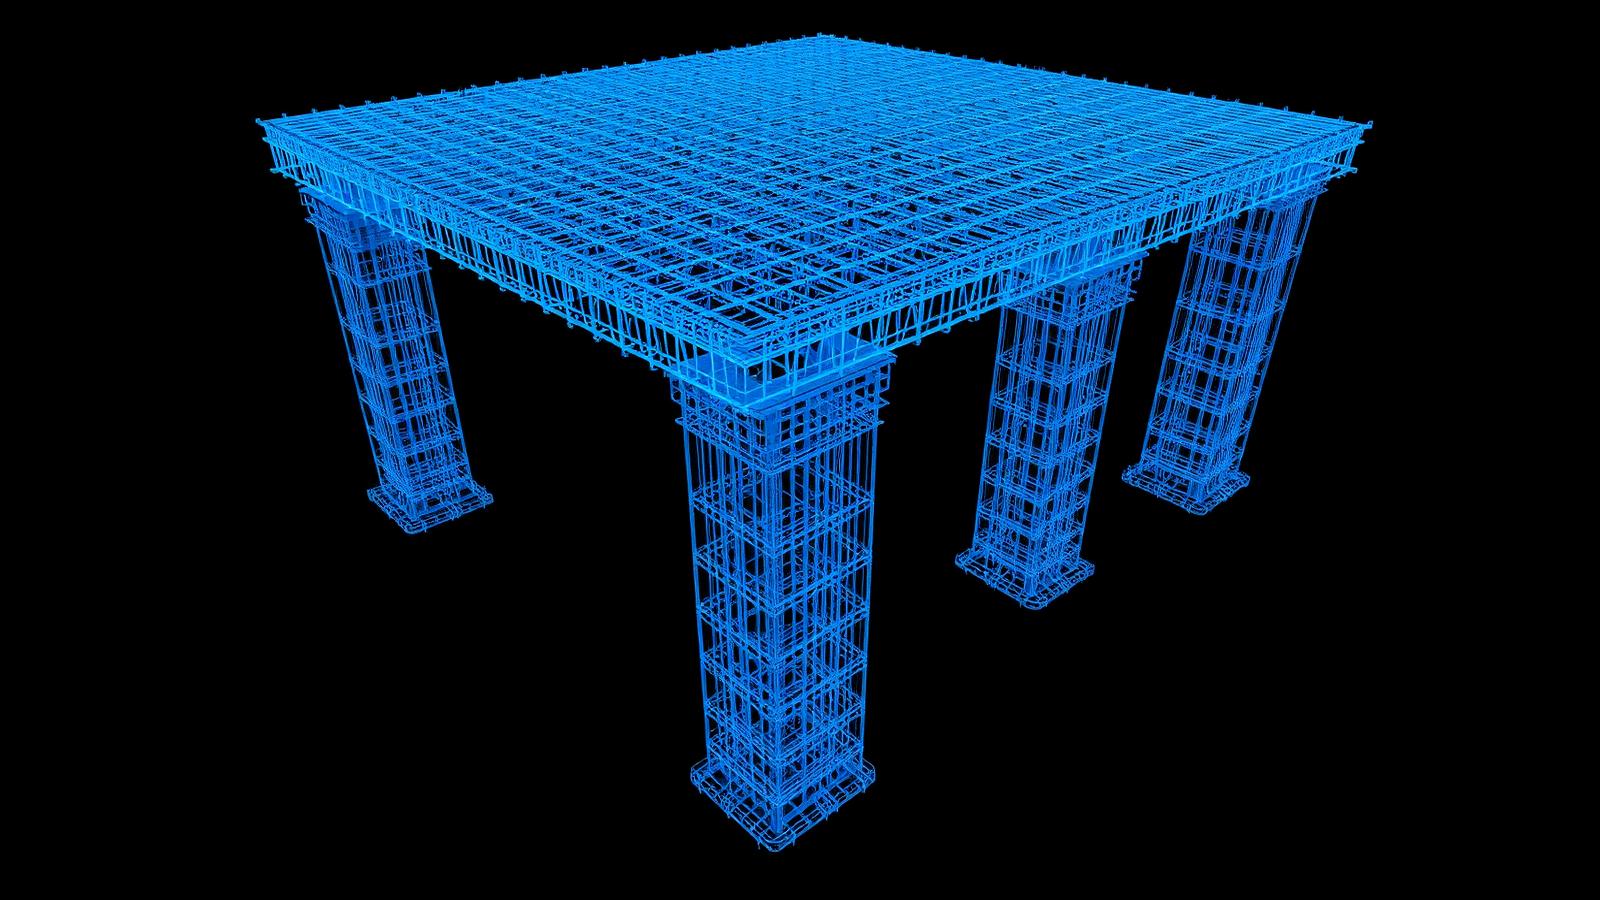
Every bar the drone passes over is measured in blue: size, spacing, cover, lap and tie pitch. Once concrete covers the steel, nothing on this page can be checked again without a hammer.
The scan list
Eight measurements, one flight
Bar size
#4 (0.500 in) vs #5 (0.625 in) confirmed from deformation pattern and diameter
Mat spacing
Center-to-center in both directions, every bay, top and bottom mat
Concrete cover
Clear distance from bar surface to formwork, deck and free edge
Mat separation
Chair height holding the top mat off the bottom mat
Column grid
Cage-to-cage centerline distance against the structural grid
Tie / stirrup spacing
Hoop pitch through the confinement zone and mid-height
Lap length
Splice overlap and stagger between adjacent bars
Hooks & bends
Standard hook extension and bend diameter at terminations
Slab on deck · two-layer mat
Top mat, bottom mat, and the gap that has to stay honest

The drone flies a fixed lawnmower route at low altitude and resolves each bar centerline from the point cloud. Spacing is reported as a running average per bay plus the worst single gap, because a 24 in gap in a 12 in mat is a rejection even when the average passes.
- Top mat#5 @ 12 in o.c. each way
- Bottom mat#4 @ 16 in o.c. each way
- Spacing tolerance± 1 in typical placement
- Max spacing rule≤ 3 × slab thickness, ≤ 18 in
- Min clear bar spacing≥ 1 in, ≥ bar diameter, ≥ 1.33 × aggregate
- Chair support pitch4 ft o.c. grid, no soft spots underfoot
Bar identification
#4 versus #5, from the air
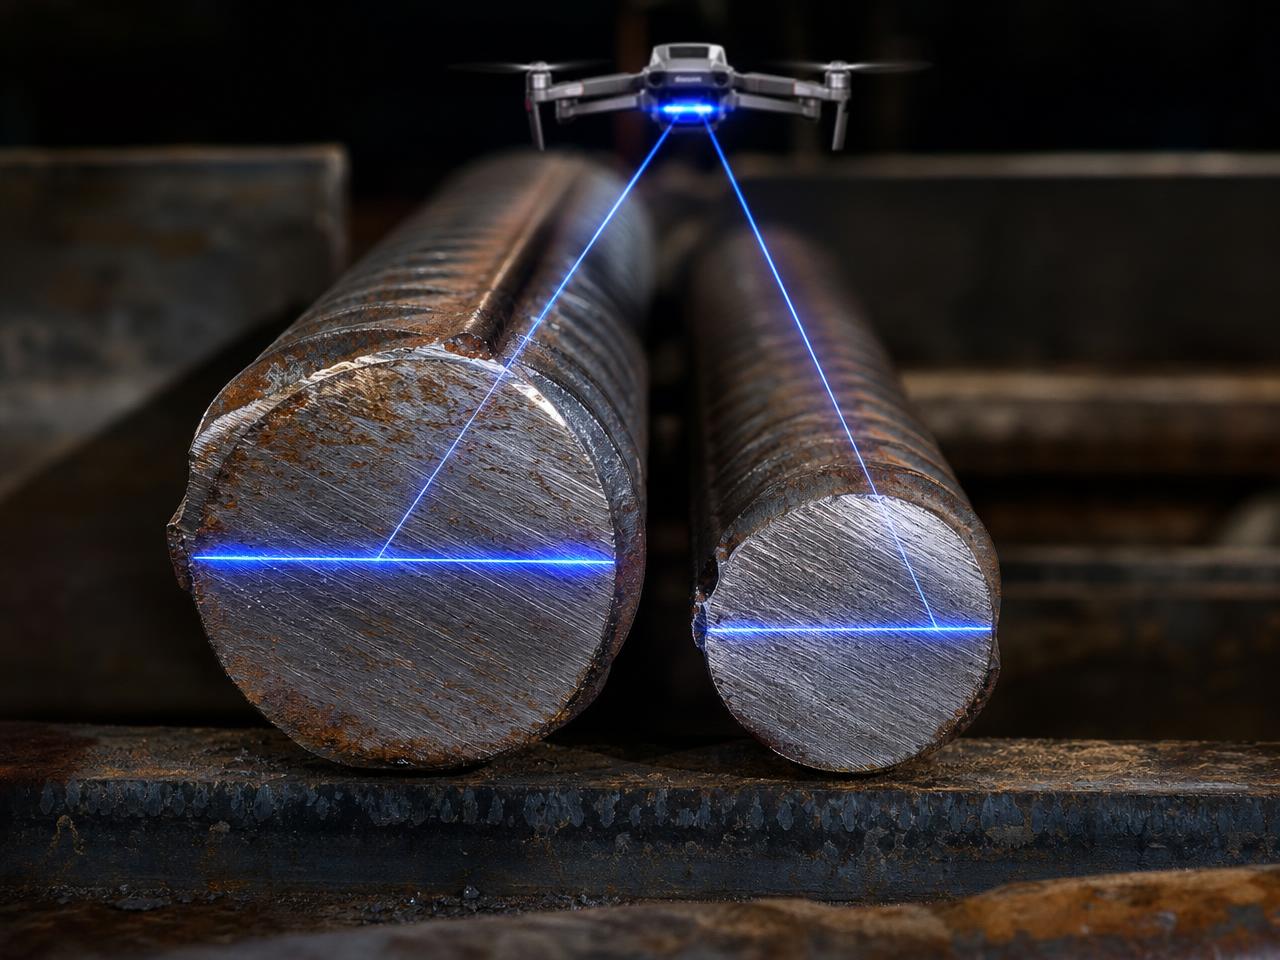
An eighth of an inch decides whether the mat matches the drawing. The scan measures the bar diameter directly and cross-checks it against the deformation spacing and the mill mark on the bar, so a substituted #4 in a #5 mat is flagged before it is tied into the pour.
- #4 bar0.500 in ø · 0.20 in² · 0.668 lb/ft
- #5 bar0.625 in ø · 0.31 in² · 1.043 lb/ft
- Area penalty if swapped−35% steel area
- Scan resolution needed≤ 2 mm on bar diameter
- Cross-checkDeformation pitch + mill mark + bar list
Cover
Cover is corrosion protection, not a detail
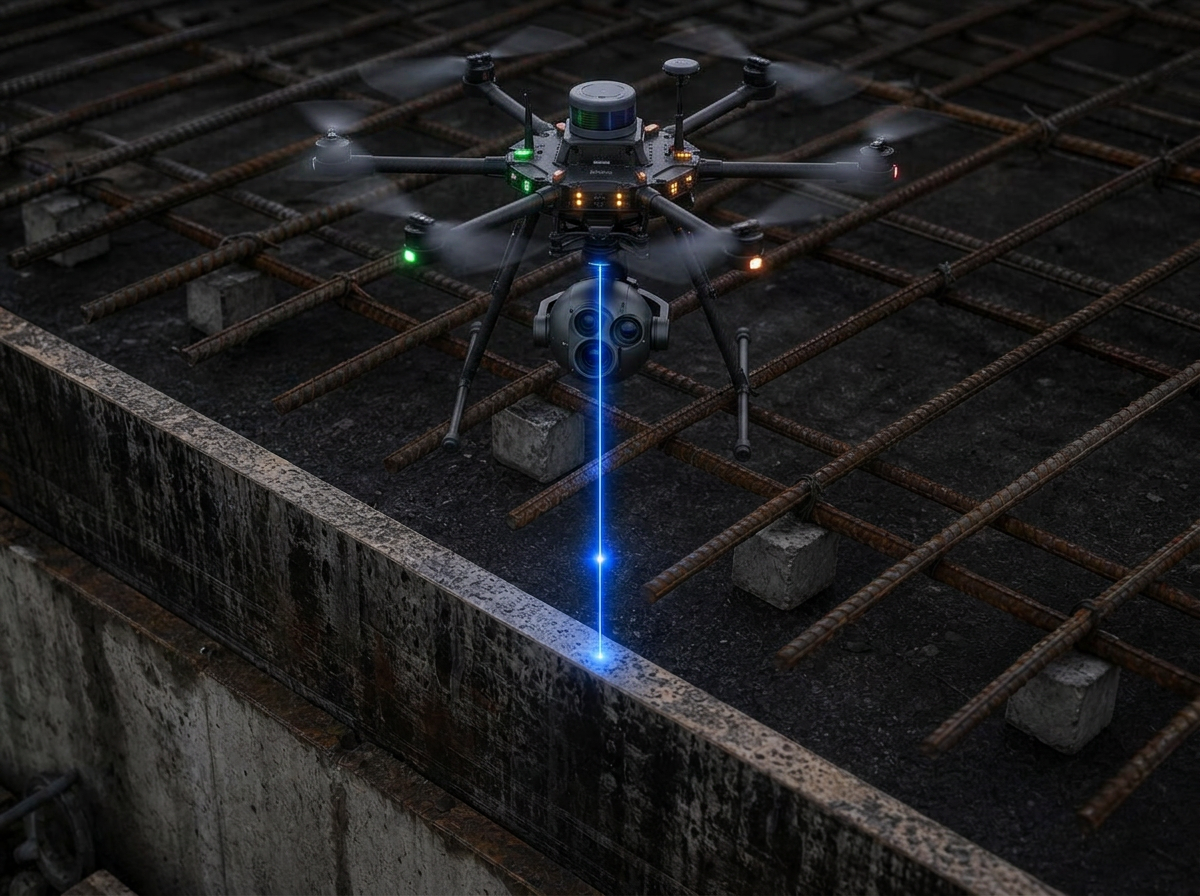
Cover is measured as the clear distance from the outside of the bar to the finished concrete face — deck below, edge beside, and top surface above. Short cover rusts and spalls; excess cover quietly removes structural depth. Both are defects and both show up as a color-mapped deviation surface across the deck.
- Slab, not exposed3/4 in clear
- Slab exposed to weather1 1/2 in clear (#5 and smaller)
- Columns, ties & stirrups1 1/2 in clear
- Cast against earth3 in clear
- Placement tolerance−3/8 in on cover, never below code minimum
Columns · layout
Cages on grid, plumb, and the right distance apart

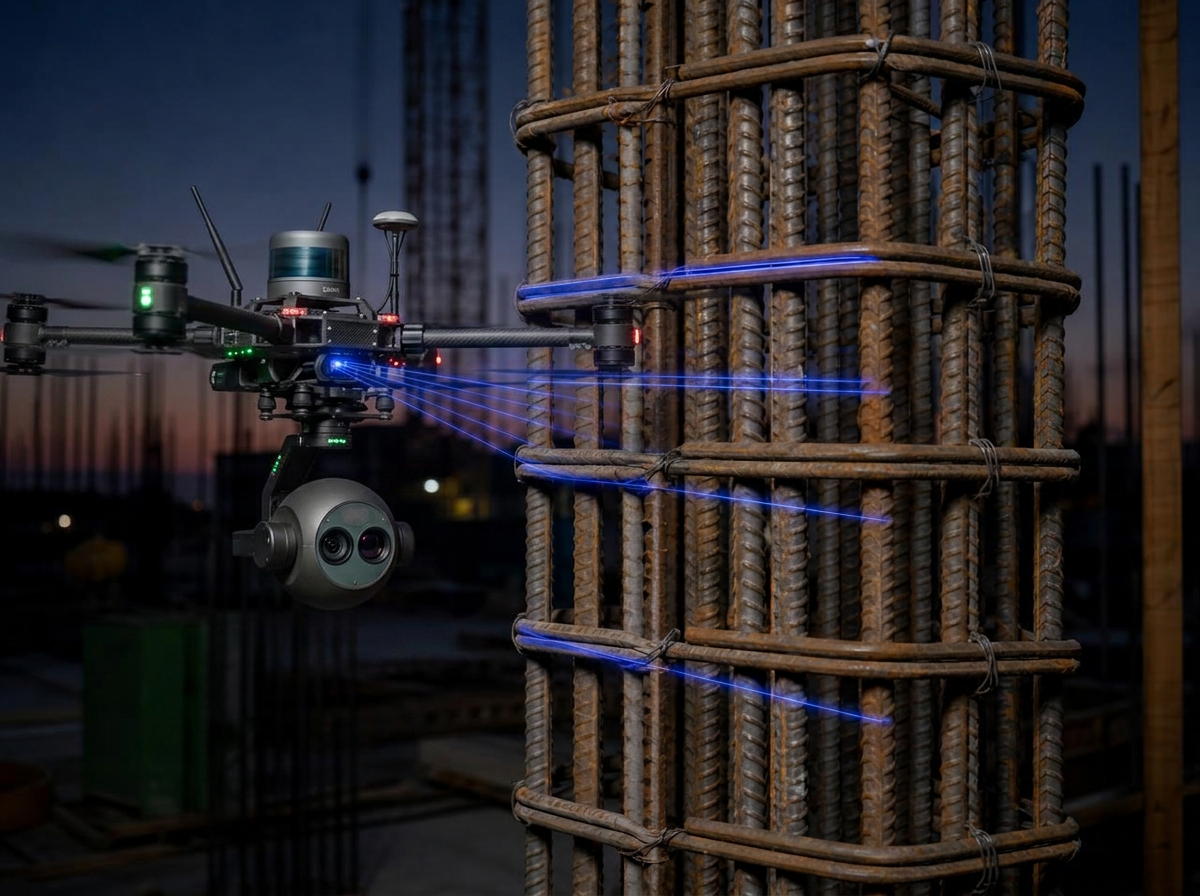
Each cage centroid is extracted from the cloud and compared to the structural grid. The report gives an offset vector per column, plumbness over the full lift, and the running cumulative error along each gridline — the one that quietly grows until the formwork will not close.
- Column-to-column layout± 1/2 in from gridline
- Cumulative grid error± 1 in over any 100 ft run
- Plumbness≤ 1/4 in per 10 ft, 1 in max
- Cage cross-section+1/2 / −1/4 in on cage dimension
- Dowel alignmentWithin bar diameter of cage vertical
Columns · confinement
Tie and stirrup spacing through the confinement zone
Hoop pitch tightens near the joint and relaxes at mid-height. The scan counts every tie along the lift, reports the pitch histogram, and marks the zone boundaries so a missed tie in the plastic hinge region cannot hide behind an acceptable average.
- Max tie spacingleast of 16 dₙ, 48 d_tie, least column dimension
- #5 verticals, #3 ties16 × 0.625 = 10 in governs
- Confinement zone pitch4 in o.c. typical, per schedule
- First tie above floor≤ 1/2 of the tie spacing
- Hook detail135° seismic hook, 6 d_tie extension
Splices
Lap length is measured, not eyeballed
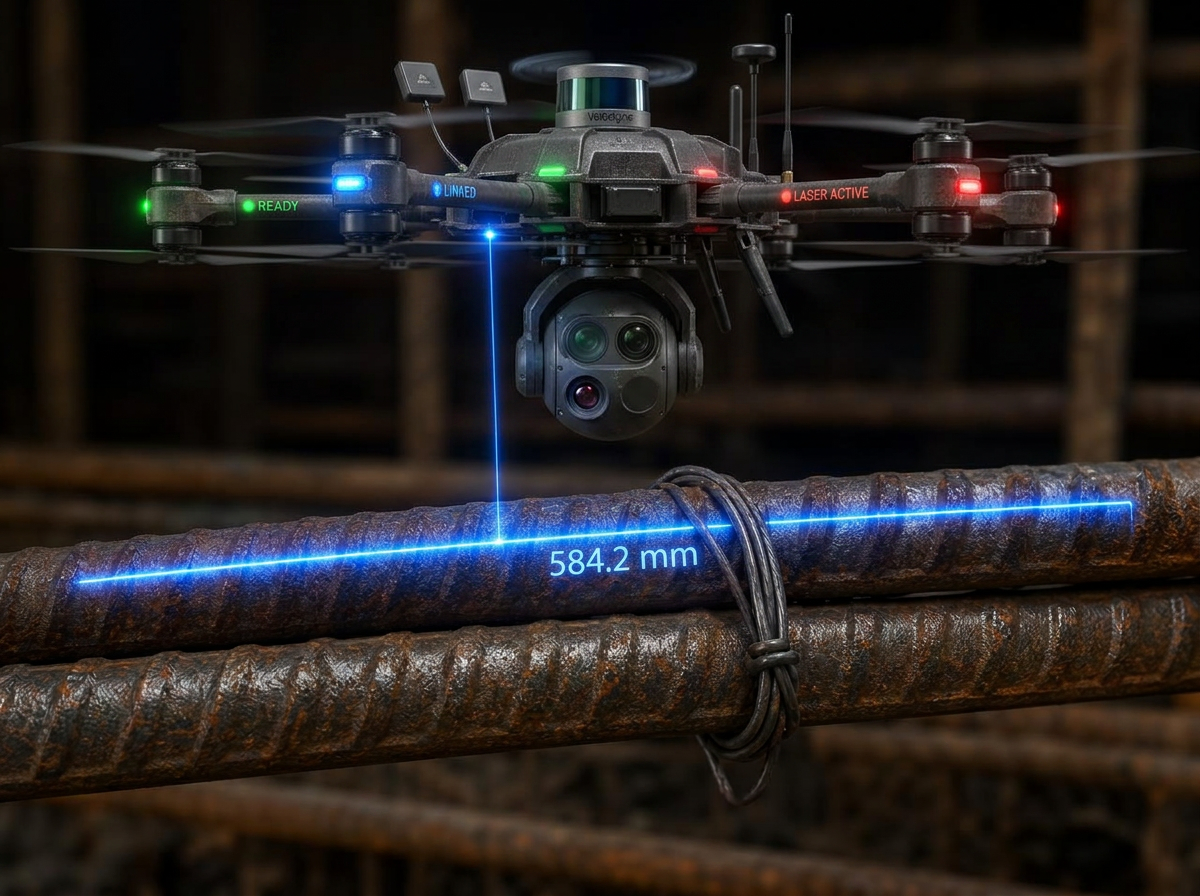
A short lap is the most common and the most invisible rebar defect on a job. The scan measures the overlapped run of each splice, checks the stagger between adjacent bars, and flags anything that lands inside a high-stress region where a Class B lap is required.
- Class A tension lap1.0 × development length, ≥ 12 in
- Class B tension lap1.3 × development length, ≥ 12 in
- #4 typical (f'c 4000, Gr 60)≈ 20 in Class A · 26 in Class B
- #5 typical (f'c 4000, Gr 60)≈ 25 in Class A · 32 in Class B
- StaggerNo more than 50% spliced at one section
- Column compression lap30 d for Grade 60
Pour quantity
Measure the slab before the pour so you order the right yardage
The same flight that verifies the steel also measures the formed volume. The drone maps deck area, edge form heights, deck deflection and every blockout, then subtracts the displaced volume of the steel and embeds. You order against a measured number instead of a padded one — and you know before the trucks roll whether the last load is needed.

- Formed areaMeasured to the inside face of every edge form
- ThicknessDeck-to-screed elevation grid, not a nominal number
- Deflection allowanceSag between shores captured in the surface model
- Blockouts & dropsOpenings, curbs, thickened edges, pile caps netted out
- Steel & embed displacementBar volume and sleeves subtracted
- Waste factorApplied once, visibly — typically 3–5%
- OutputCubic yards per pour zone, per truck load
Cost of not catching it
Ordering blind runs 5–10% long on a typical deck. On a 200 cy pour that is 10–20 wasted yards plus short-load and disposal fees — roughly $2,000–$4,500 gone on a single pour. Under-ordering is worse: a cold joint in a slab that was designed monolithic.
Deliverable
A signed pre-pour release, backed by a measurable model
Deviation map
Color-coded spacing, cover and layout deviation across the whole placement, with every exceedance located to the bay.
Bar schedule reconciliation
Measured sizes, counts and laps compared line by line against the approved bar list and placing drawings.
Time-stamped release
Point cloud, imagery and defect log archived before the pour, so a later dispute has a record instead of an argument.
Values shown are typical US practice for Grade 60 bar and normal-weight concrete. The approved structural drawings, project specification and governing code edition always control.
What it costs when nobody’s watching
Every one of these measurements is cheap before the pour and structural after it
35%
steel area lost when a #4 goes in where a #5 was drawn. Caught before the pour it is a bar swap; caught after, correcting an undersized mat means breakout — the same 5–20% rework band that applies to the affected scope.
Source: CII; Dodge Data & Analytics, SmartMarket Report on Project Rework (2018)
up to 70%
of all construction rework traces to engineering, design and coordination errors — the class short lap splices, wrong spacing and missed cover fall into, and the most invisible of them once concrete is placed.
Source: Peer-reviewed rework literature, summarized across multiple studies
90%
inspection labor and cost cut per cycle when a contractor moved to continuous autonomous scanning: a 4-hour, 2-person walk became a 30-minute, 1-person flight.
Source: Sundt Construction case study, published by Sundt.com and Skydio (2021) — self-reported vendor/customer example, not an industry average
“A short lap is the cheapest thing on the deck to fix and the most expensive thing in the building to find later.”
Sonar · ultrasonic ranging
Laser and LiDAR are the primary measurement layer, but they lose confidence on dark, wet, dusty or mirror-like surfaces and at very short standoff. Sonar fills that gap: ultrasonic pulses resolve the small stuff — millimetre-scale gaps, offsets, thin clearances and shallow voids — in low light, through airborne dust and against surfaces a laser skips off. On this page it is what confirms clear cover under the bar and the tight gap between mat and form face, where a beam angle is too shallow to trust.
What you’ll receive
Concrete & rebar verification — marked-up DXF overlay on your plan + PDF exception report + supporting point cloud (LAS/E57) if a dispute ever needs the raw measurement.
Open formats only: GeoTIFF · LAS/LAZ · E57 · OBJ/FBX · DWG/DXF · LandXML · PDF · CSV. No proprietary viewer required.